Call Statistics
Weekly Call Summaries
Week of July 12, 2026Week of July 5, 2026Week of June 28, 2026Week of June 21, 2026Week of June 14, 2026
Community Demographics (Interactive Dashboard provided by CRAIG Community Risk Assessment)
Previous Years Statistics (data presented for informational purposes only)
Charts last updated January 2022
See data through December 2022 in our annual reports: https://www.estesvalleyfire.org/annual-reports
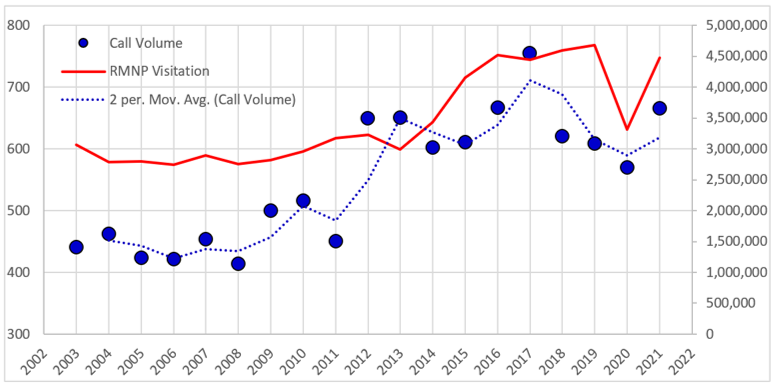
Call count by year (blue dots). Rocky Mountain National Park visitation shown as the red line on the right axis.
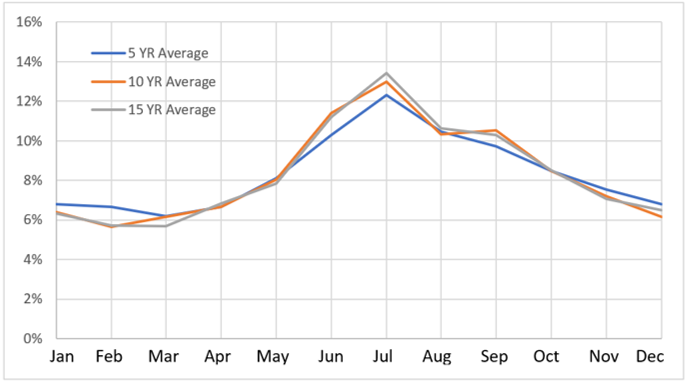
Seasonality of call volume by month
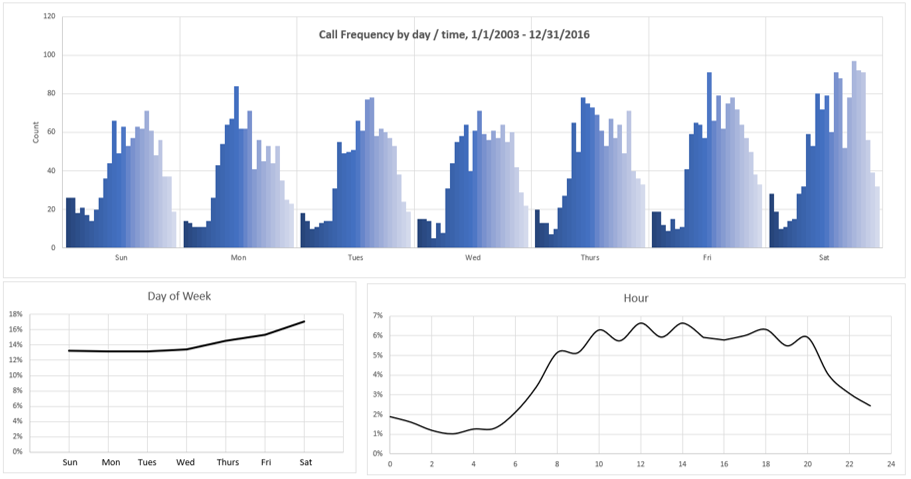
Call frequency by time of day and day of week
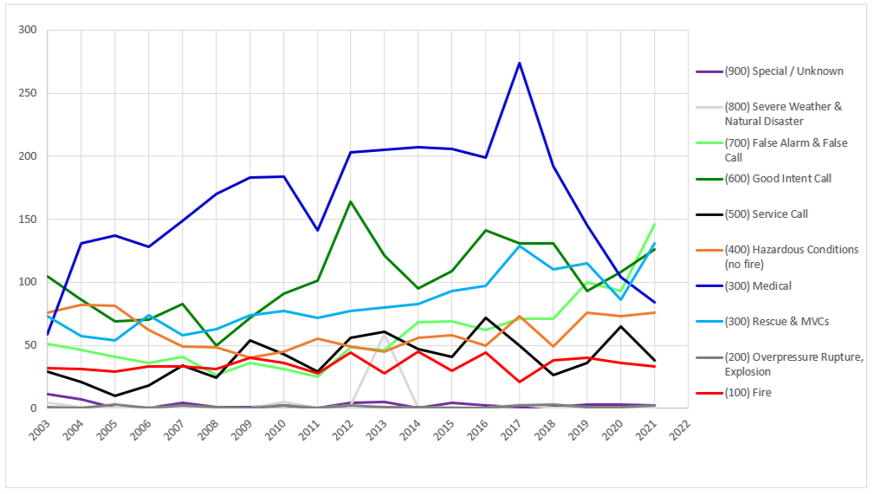
Call type frequency over time (graph)
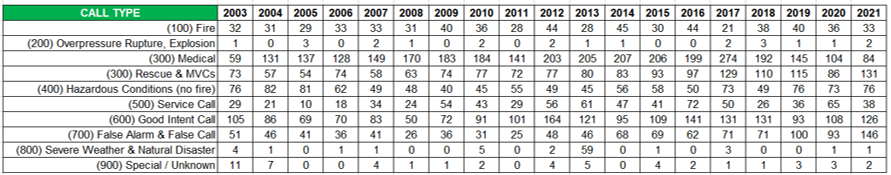
Call type frequency over time (table)